Billing data is the most accurate and complete record of your business your company produces. Every customer interaction that generates revenue leaves a trace in the billing system: the subscription created, the usage event emitted, the invoice finalized, the payment collected. These traces, when assembled correctly, form a revenue intelligence layer that is richer and more actionable than anything produced by a CRM or a product analytics tool alone.
The gap between "we have billing data" and "we have revenue intelligence" is a data modeling and presentation problem. Most companies with billing data have invoices and payments in a database. Very few have a coherent model that derives MRR, tracks net dollar retention, enables cohort-level profitability analysis, and surfaces early signals of expansion or churn. This post is about closing that gap.
Constructing MRR from Raw Billing Events
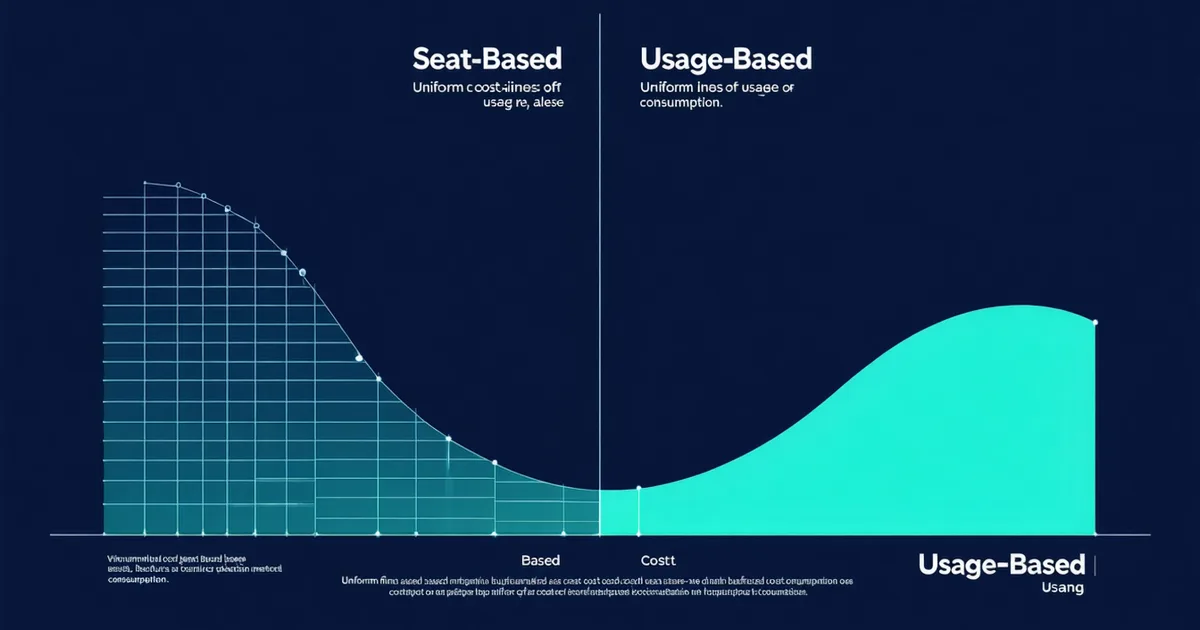
Monthly recurring revenue (MRR) for a subscription-based product is straightforward: sum of all active subscriptions' monthly equivalent value. For usage-based billing, it's more nuanced — the "monthly value" isn't known until the billing period closes, and even then it varies month to month.
The standard approach for usage-based MRR is to use the trailing 3-month average of billed revenue per customer as the MRR estimate for that customer. This smooths the volatility of pure consumption billing into a stable metric that finance teams can work with, while accurately reflecting the revenue run-rate for a customer whose usage has stabilized.
WITH customer_monthly_revenue AS (
  SELECT
    customer_id,
    DATE_TRUNC('month', invoice_date) AS month,
    SUM(total_amount_usd) AS monthly_revenue
  FROM invoices
  WHERE status = 'paid'
    AND invoice_date >= CURRENT_DATE - INTERVAL '4 months'
  GROUP BY customer_id, DATE_TRUNC('month', invoice_date)
),
trailing_average AS (
  SELECT
    customer_id,
    AVG(monthly_revenue) AS mrr_estimate
  FROM customer_monthly_revenue
  WHERE month >= DATE_TRUNC('month', CURRENT_DATE) - INTERVAL '3 months'
    AND month < DATE_TRUNC('month', CURRENT_DATE)
  GROUP BY customer_id
)
SELECT
  SUM(mrr_estimate) AS total_mrr,
  COUNT(DISTINCT customer_id) AS active_customers,
  AVG(mrr_estimate) AS avg_mrr_per_customer
FROM trailing_average;
The trailing average approach understates MRR for rapidly growing customers (whose recent months are much higher than their 3-month average) and overstates it for customers who are declining. For revenue forecasting, it's more useful to track the ratio of the most recent month's revenue to the 3-month average — a ratio significantly above 1.0 signals an account that's growing into expansion territory.
Net Dollar Retention Tracking
Net dollar retention (NDR) — also called net revenue retention (NRR) — measures how much of the revenue from a cohort of customers at time T is retained (and grown) by time T+12 months. An NDR above 100% means your existing customers are spending more this year than they did last year, which is the clearest signal of product-market fit for a usage-based product.
The calculation: take all customers who paid in a specific month 12 months ago. Sum their revenue in that base month. Sum their revenue in the current month (including churned customers as $0). NDR = (current month revenue from base cohort) / (base month revenue from same cohort) × 100.
An NDR above 110-120% is typical for healthy usage-based infrastructure products — customers who integrate deeply tend to grow their consumption as their own product grows. An NDR below 100% means churned revenue is outpacing expansion revenue from retained customers — a warning signal regardless of how fast you're acquiring new customers.
For usage-based billing specifically, NDR tends to be more predictive of business health than for pure subscription SaaS, because it captures both account retention and usage growth in a single metric. A customer who stays but reduces their usage registers in NDR as a revenue decline, which is the correct signal — they're becoming less valuable even if they haven't churned.
Cohort Analysis: Acquisition Channel Profitability
Cohort analysis in billing data goes beyond the standard "what is MRR by signup month" view. When billing data is joined with acquisition source data (from your CRM or marketing attribution), the resulting analysis answers the question that CFOs actually want answered: which acquisition channels produce customers who generate long-term revenue, not just initial conversion?
A typical cohort analysis might reveal: customers who signed up via developer documentation (organic inbound) have an average 12-month LTV that is 2-3x customers who signed up via paid advertising campaigns, because documentation-driven signups have higher product understanding and integration depth at the time of conversion. This insight affects budget allocation, content investment, and sales prioritization — but you can only see it if your billing data includes the acquisition channel at the customer level.
The implementation requires a join between your billing data and your CRM or marketing data. The join key is typically customer email or customer ID if you've maintained consistency across systems. This cross-system join is often the hardest part of cohort analysis for teams that haven't done it before — billing system customer IDs rarely match CRM lead IDs without explicit mapping.
We're not saying you need a full data warehouse for this analysis. We're saying you need a reliable join key between your billing system and at least one source of customer acquisition data. Without this join, revenue analytics operates on financially accurate but strategically incomplete data.
The CFO Dashboard: What Actually Gets Used
Revenue analytics dashboards are frequently built for engineers and rarely built for CFOs. The result: technically complete dashboards full of data that finance teams don't use because it doesn't answer the questions they actually have. The questions a CFO needs answered from billing data:
- What is our current MRR and what is the trend over the last 6 months? — not a chart with 24 months of noise, but a 6-month view with a trend line and a current-month number in large type.
- What is our net dollar retention and how does it compare to last quarter? — a single percentage with a delta and a brief explanation of what drove the change (new expansions, churned accounts, plan changes).
- Which customer accounts are growing and which are declining? — a table of the top 20 accounts by absolute revenue change (positive and negative) in the last 30 days. This is the customer-level view that allows intervention before churn becomes formal.
- What is the average invoice amount trend? — for usage-based billing, this is a proxy for whether customers are growing into the product or have plateaued.
- What is our MRR at risk from customers in the dunning sequence? — this is the forward-looking revenue risk signal: how much revenue is currently in a failed-payment state.
The most actionable version of this dashboard requires live data, not daily batch exports. When a major customer's usage drops by 40% in a single week, you want to know that week, not at the next monthly business review. The billing data layer is closest to the revenue signal of any system you have — use it as a real-time monitoring tool, not just a reporting tool.
Billing data's highest value is as a leading indicator. Usage decline precedes contract cancellation. Overage invoices predict expansion contract negotiation. Invoice dispute rates predict churn risk. The finance teams that build this intelligence layer on top of their billing data shift from reporting on what happened to anticipating what's about to happen — which is a materially different and more valuable capability.